 by
by As hurricanes intensify, hurricane hunters in the sky are doing something unimaginable: flying through the center of the storm. With each pass, the scientists aboard these planes take measurements that satellites cannot and send them to forecasters at the National Hurricane Center.
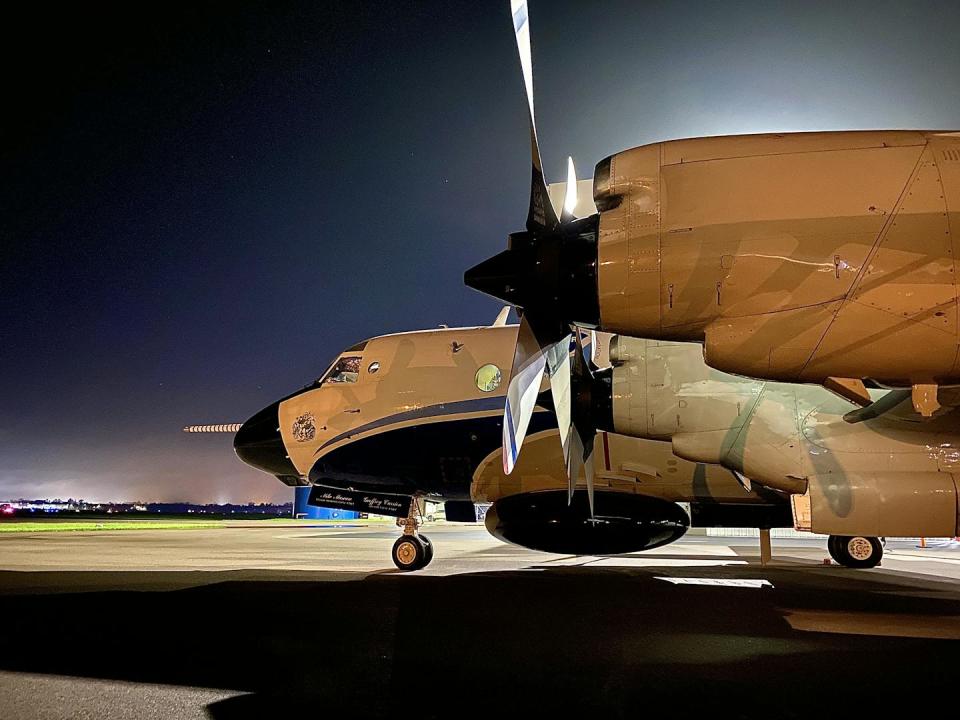
Jason Dunion, a University of Miami meteorologist, leads hurricane field programs for the National Oceanic and Atmospheric Administration. He described the technology the team uses to measure hurricane behavior in real time and the experience aboard the P-3 Orion as it passes through the eyewall of a hurricane.
What happens on board a hurricane hunter when you fly into a storm?
Basically, we’re taking a flying lab into the heart of a hurricane, all the way up to Category 5. As we fly, we’re gathering data and sending it to forecasters and climate modelers.
In the P-3s, we routinely cut through the middle of the storm, right into the eye. X pattern picture – we keep cutting through the storm often during missions. These may be developing storms, or they may be Category 5 storms.
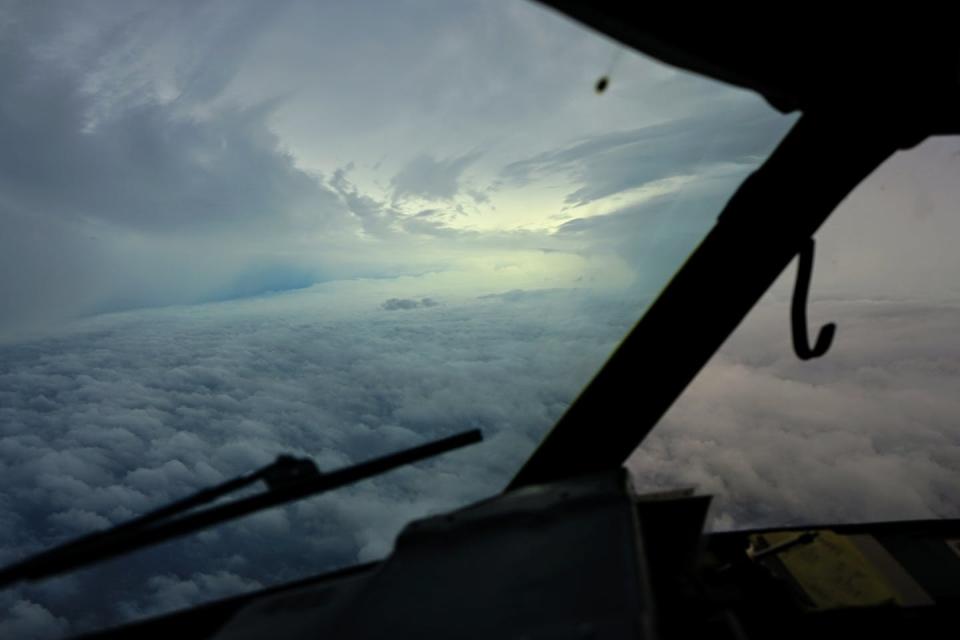
We are usually flying at an altitude of about 10,000 feet, about a quarter of the way between the surface of the ocean and the top of the storm. We are trying to cut through the roughest part of the storm because we are trying to measure the strongest winds for the Hurricane Center.
That must be tough. Can you describe the experience of scientists on these flights?
My most intense flight was Dorian in 2019. The storm was near the Bahamas and quickly growing into a very strong Category 5 storm, with winds around 185 mph. It felt like a feather in the wind.
When we were coming through the eyewall of Dorian, it was all seat belts. You can lose a few hundred feet in a few seconds if you have a down draft, or you can hit an upgrade and gain a few hundred feet in a second. It’s very much like a rollercoaster ride, but you never know exactly when the next up or down is coming.

At one point, we had G forces of 3 to 4 Gs. That’s what astronauts experience during a rocket launch. We can also get zero G for a few secondsand anything not strapped down will float.
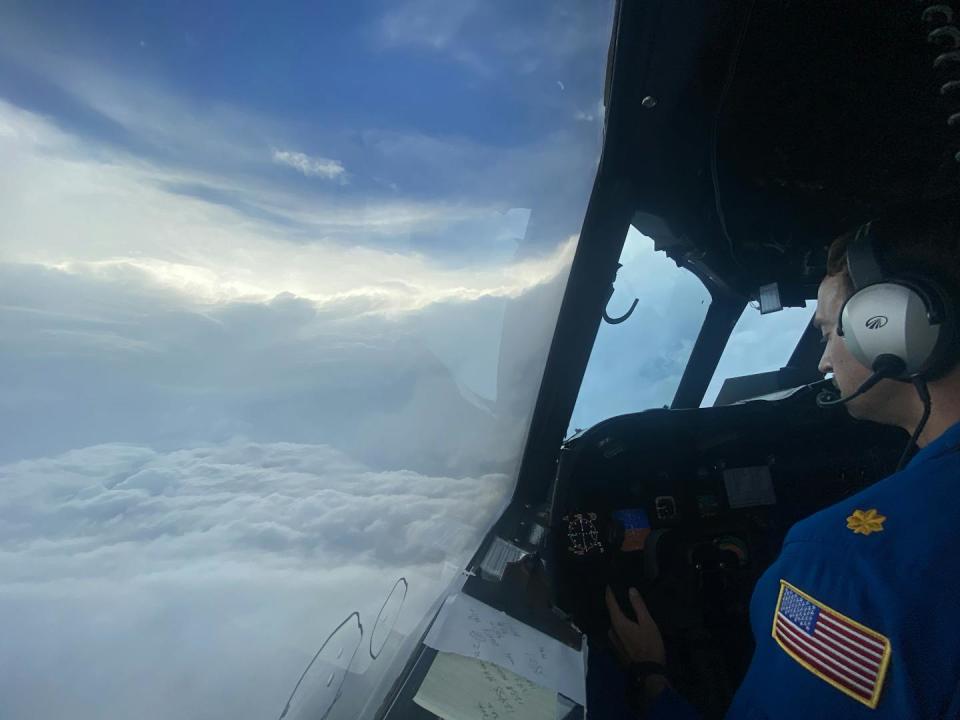
Even in the rough parts of the storm, scientists like myself are busy on computers working up the data. A technician in the back may have sent a dropsonde from the belly of the plane, and we are checking the quality of the data and sending it to modeling centers and the National Hurricane Center.
What are you learning about hurricanes from these flights?
One of our goals is to better understand why storms intensify quickly.
Rapid acceleration is when a storm increases speed by 35 mph in one day. That’s the equivalent of going from a Category 1 to a major Category 3 storm in a short period of time. Ida (2021), Dorian (2019) and Michael (2018) are just a few recent hurricanes that have gone quickly. When that happens close to the ground, it can catch people off guard, and quickly becomes dangerous.
Since rapid intensification can happen in a very short amount of time, we need to be out there with the hurricane hunters taking measurements as the storm gathers.
So far, rapid intensification is difficult to predict. We may begin to see the ingredients coming together quickly: Is the ocean warm to great depth? Is the atmosphere nice and humid, with lots of moisture around the storm? Are the winds favorable? We also look at the inner core: What does the structure of the storm look like, and is it starting to consolidate?
Satellites can give forecasters basic insight, but we need to put our hurricane hunters into the storm itself to really pick out the hurricane.
What does a rapidly intensifying storm look like?
Hurricanes like to stand up straight – think spinning top. So one thing we’re looking for is alignment.
A storm that is not yet fully assembled may have a low-level circulation a few kilometers above the ocean that is not consistent with its mid-level circulation 6 or 7 kilometers higher. That’s not a very healthy storm. But a few hours later, we could fly back into the storm and notice that the two centers are more lineup up. That’s a sign that it could intensify quickly.
We also look at the boundary layer, the area just above the sea. Breathing storms: They draw air in at low levels, rush the air up at the eyewall, and then fan it out at the top of the storm and out of the center. That’s why we get those huge updates in the eyewall.
So we could look at our dropsonde or tail doppler radar data for how the winds are blowing at the boundary layer. Is that really moist air rushing into the center of the storm? If the boundary layer is deep, the storm can also take more inhale.
We also look at the structure. The storm often looks healthy on the satellite, but we go in with the radar and the structure is sloppy or the eye may be filled with clouds, which tells us that the storm is not ready enough to intensify quickly . But, during that flight, we may begin to change the structure quickly.
Air in, up and out – the breathing – is a great way to diagnose a storm. If that breathing looks healthy, it can be a good sign of a growing storm.
What tools do you use to measure and predict hurricane behavior?
We need instruments that measure not only the atmosphere but the ocean as well. The winds can steer a storm or tear it apart, but its fuel is the heat and moisture of the ocean.
We use dropsondes to measure temperature, humidity, pressure and wind speed, and send data back every 15 feet or so all the way to the ocean surface. All that data goes to the National Hurricane Center and modeling centers so they can get a better representation of the atmosphere.

One P-3 has a laser – a CRL, or compact rotating raman LiDAR – that can measure temperature, humidity and aerosols from the aircraft all the way down to the ocean surface. It can give us an idea of how juicy the atmosphere is, and therefore how favorable it is to sustain a storm. The CRL operates continuously over the entire flight range, so you get this beautiful curtain below the aircraft that shows the temperature and humidity.
The planes also have a doppler tail radar, which measures how moisture droplets in the air are blowing to determine how the wind is moving. That gives us a 3D view of the wind field, like an X-ray of the storm. You can’t get that from a satellite.
We are also sending out ocean probes called AXBTs – aircraft wearable bathythermograph – ahead of the storm. These probes measure water temperature down hundreds of feet. Generally, surface temperatures of 26.5 degrees Celsius (80 Fahrenheit) and above are favorable for hurricanes, but the depth of that warmth is also important.
If you have warm ocean water it may be 85 F at the surface, but just 50 feet down the water is a little cooler, the hurricane will mix in the cold water quite quickly and weaken the storm. But deep, warm water, like we find in the Gulf of Mexico, provides additional energy that can fuel the storm.
We are also testing new technology – small drones that we can launch from the belly of a P-3. They have about a 7 to 9-span wingspan and are basically a weather station with wings.
One of the drones dropped in the eye could measure pressure changes, indicating whether a storm is getting stronger. If we could drop a drone in the eyewall and have it orbit there, it could measure where the strongest winds are – that’s another important piece of data for forecasters. We also don’t measure much in the boundary layer because it’s not a safe place for an airplane to fly.
You also focused on the Cabo Verde islands off Africa recently. What are you looking for then?
The Cabo Verde Islands are in the Atlantic hurricane nursery. The seedling of hurricanes comes out of Africa, and we are trying to find out what are the tipping points for these disturbances to become storms.
More than half of the named storms we get in the Atlantic come from this nursery, including about 80% of major hurricanes, so it’s important, even though the disturbance is maybe seven to 10 days before the hurricane formed.
In Africa, many thunderstorms develop along the southern border of the Sahara desert with the cooler and wetter Sahel region in summer. The difference in temperature can cause ripples to develop in the atmosphere which we call tropical waves. Some of these tropical waves are precursors to hurricanes. However, the Saharan air layer – huge dust storms that come out of Africa every three to five days or so – can suppress hurricanes. These storms peak from June to mid-August. After that, a tropical disturbance has a better chance of reaching the Caribbean.
At some point in the not-too-distant future, the National Hurricane Center will have to do a seven-day forecast, instead of just five. We’re figuring out how to improve that early forecast.
This article is republished from The Conversation, a non-profit, independent news organization that brings you reliable facts and analysis to help you make sense of our complex world. It was written by Jason Dunion, University of Miami
Read more:
Jason Dunion receives funding from NOAA, NASA, and the Office of Naval Research.